Final submission is really close. Luckily I finished everything in time. I realized writing the words took much shorter than making graphics, but the graphics are really important.
Research Plan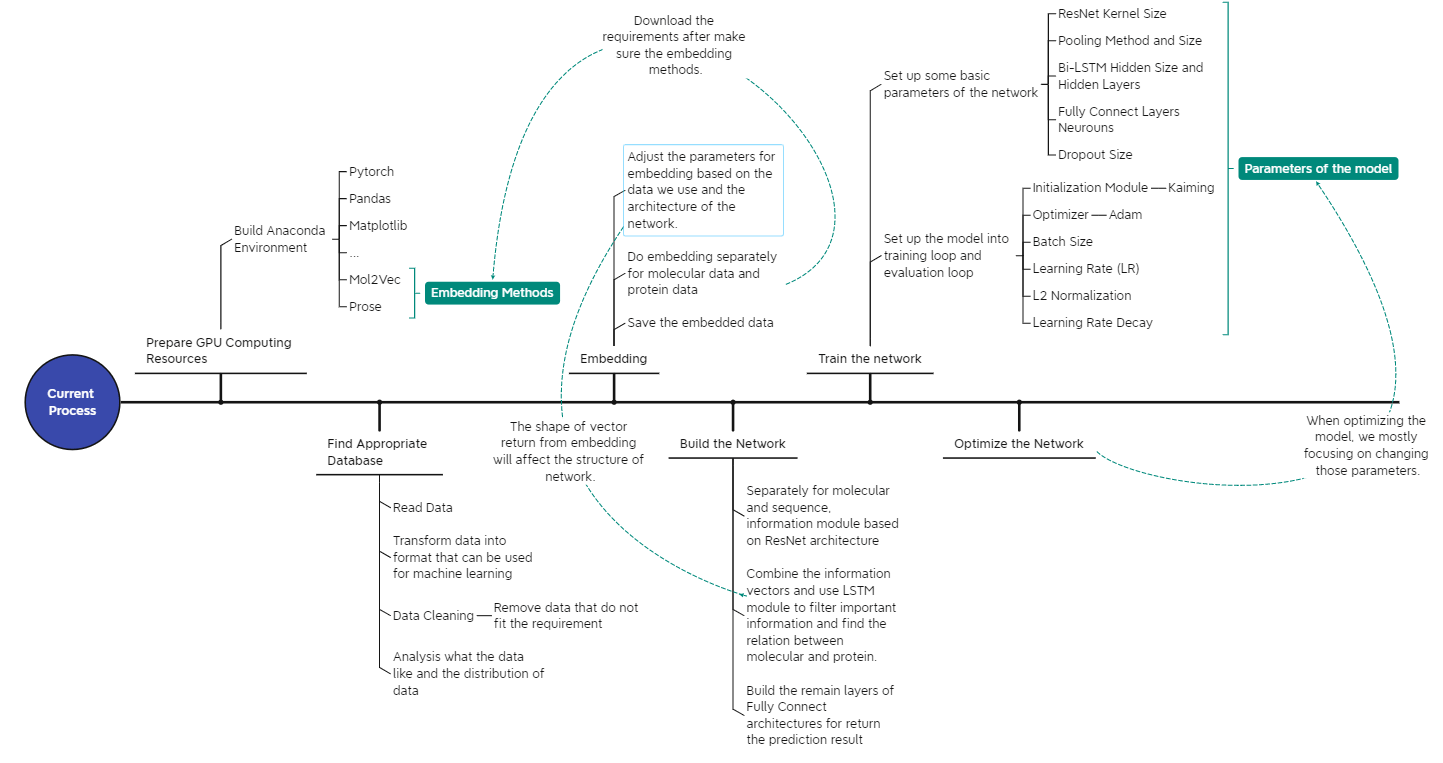
Figure 2. Designed workflow of building the DeepPLA model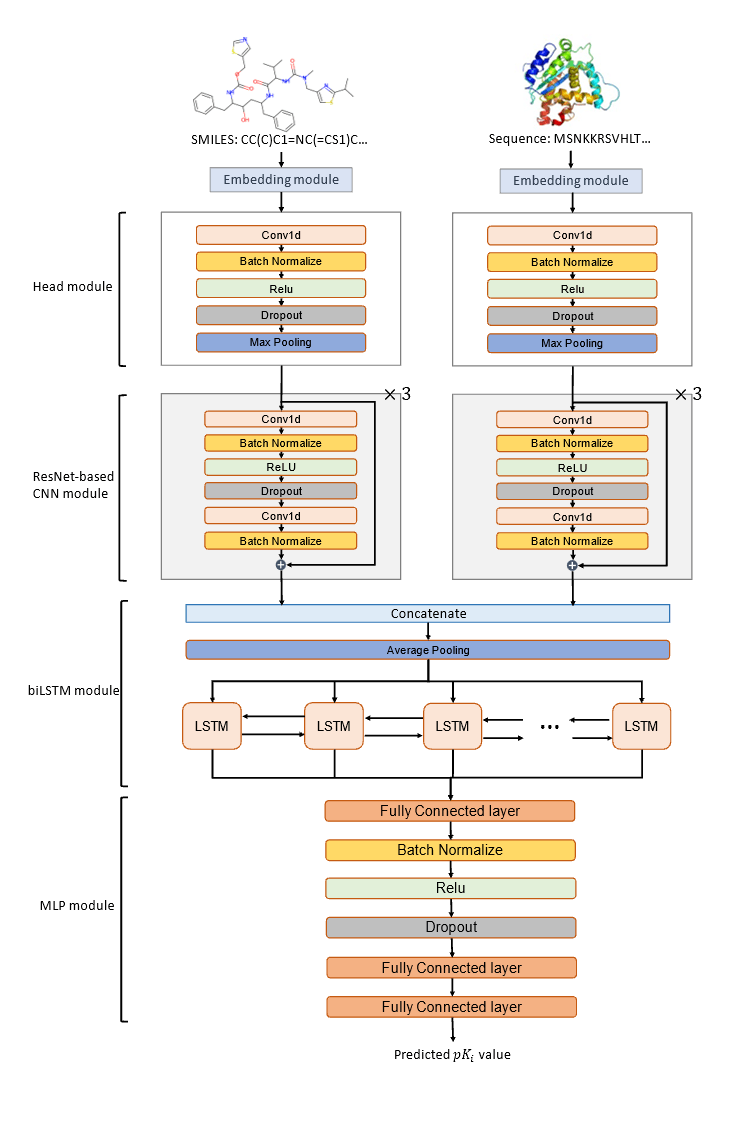
Figure 3. DeepPLA architecture
I have built a preliminary version of DeepPLA according to the architecture shown in Figure 3. For model training, I am using data from the BindingDB (T. Liu et al., 2007) database with Ki value labels. BindingDB is a publicly accessible database that documents binding affinity measurements on the interactions for protein considered to be drug targets and small molecule drugs, with data curated from journal publications and open access sources. From a total number of 2,278,226 data (drug-protein interaction), I keep those with desired binding affinity Ki (490,605) and dropped low-quality entries, resulting with 249,517 data points. A summary of my data cleaning procedure is shown in Figure 4. For feature extraction, I am using two external embedding modules, Mol2Vec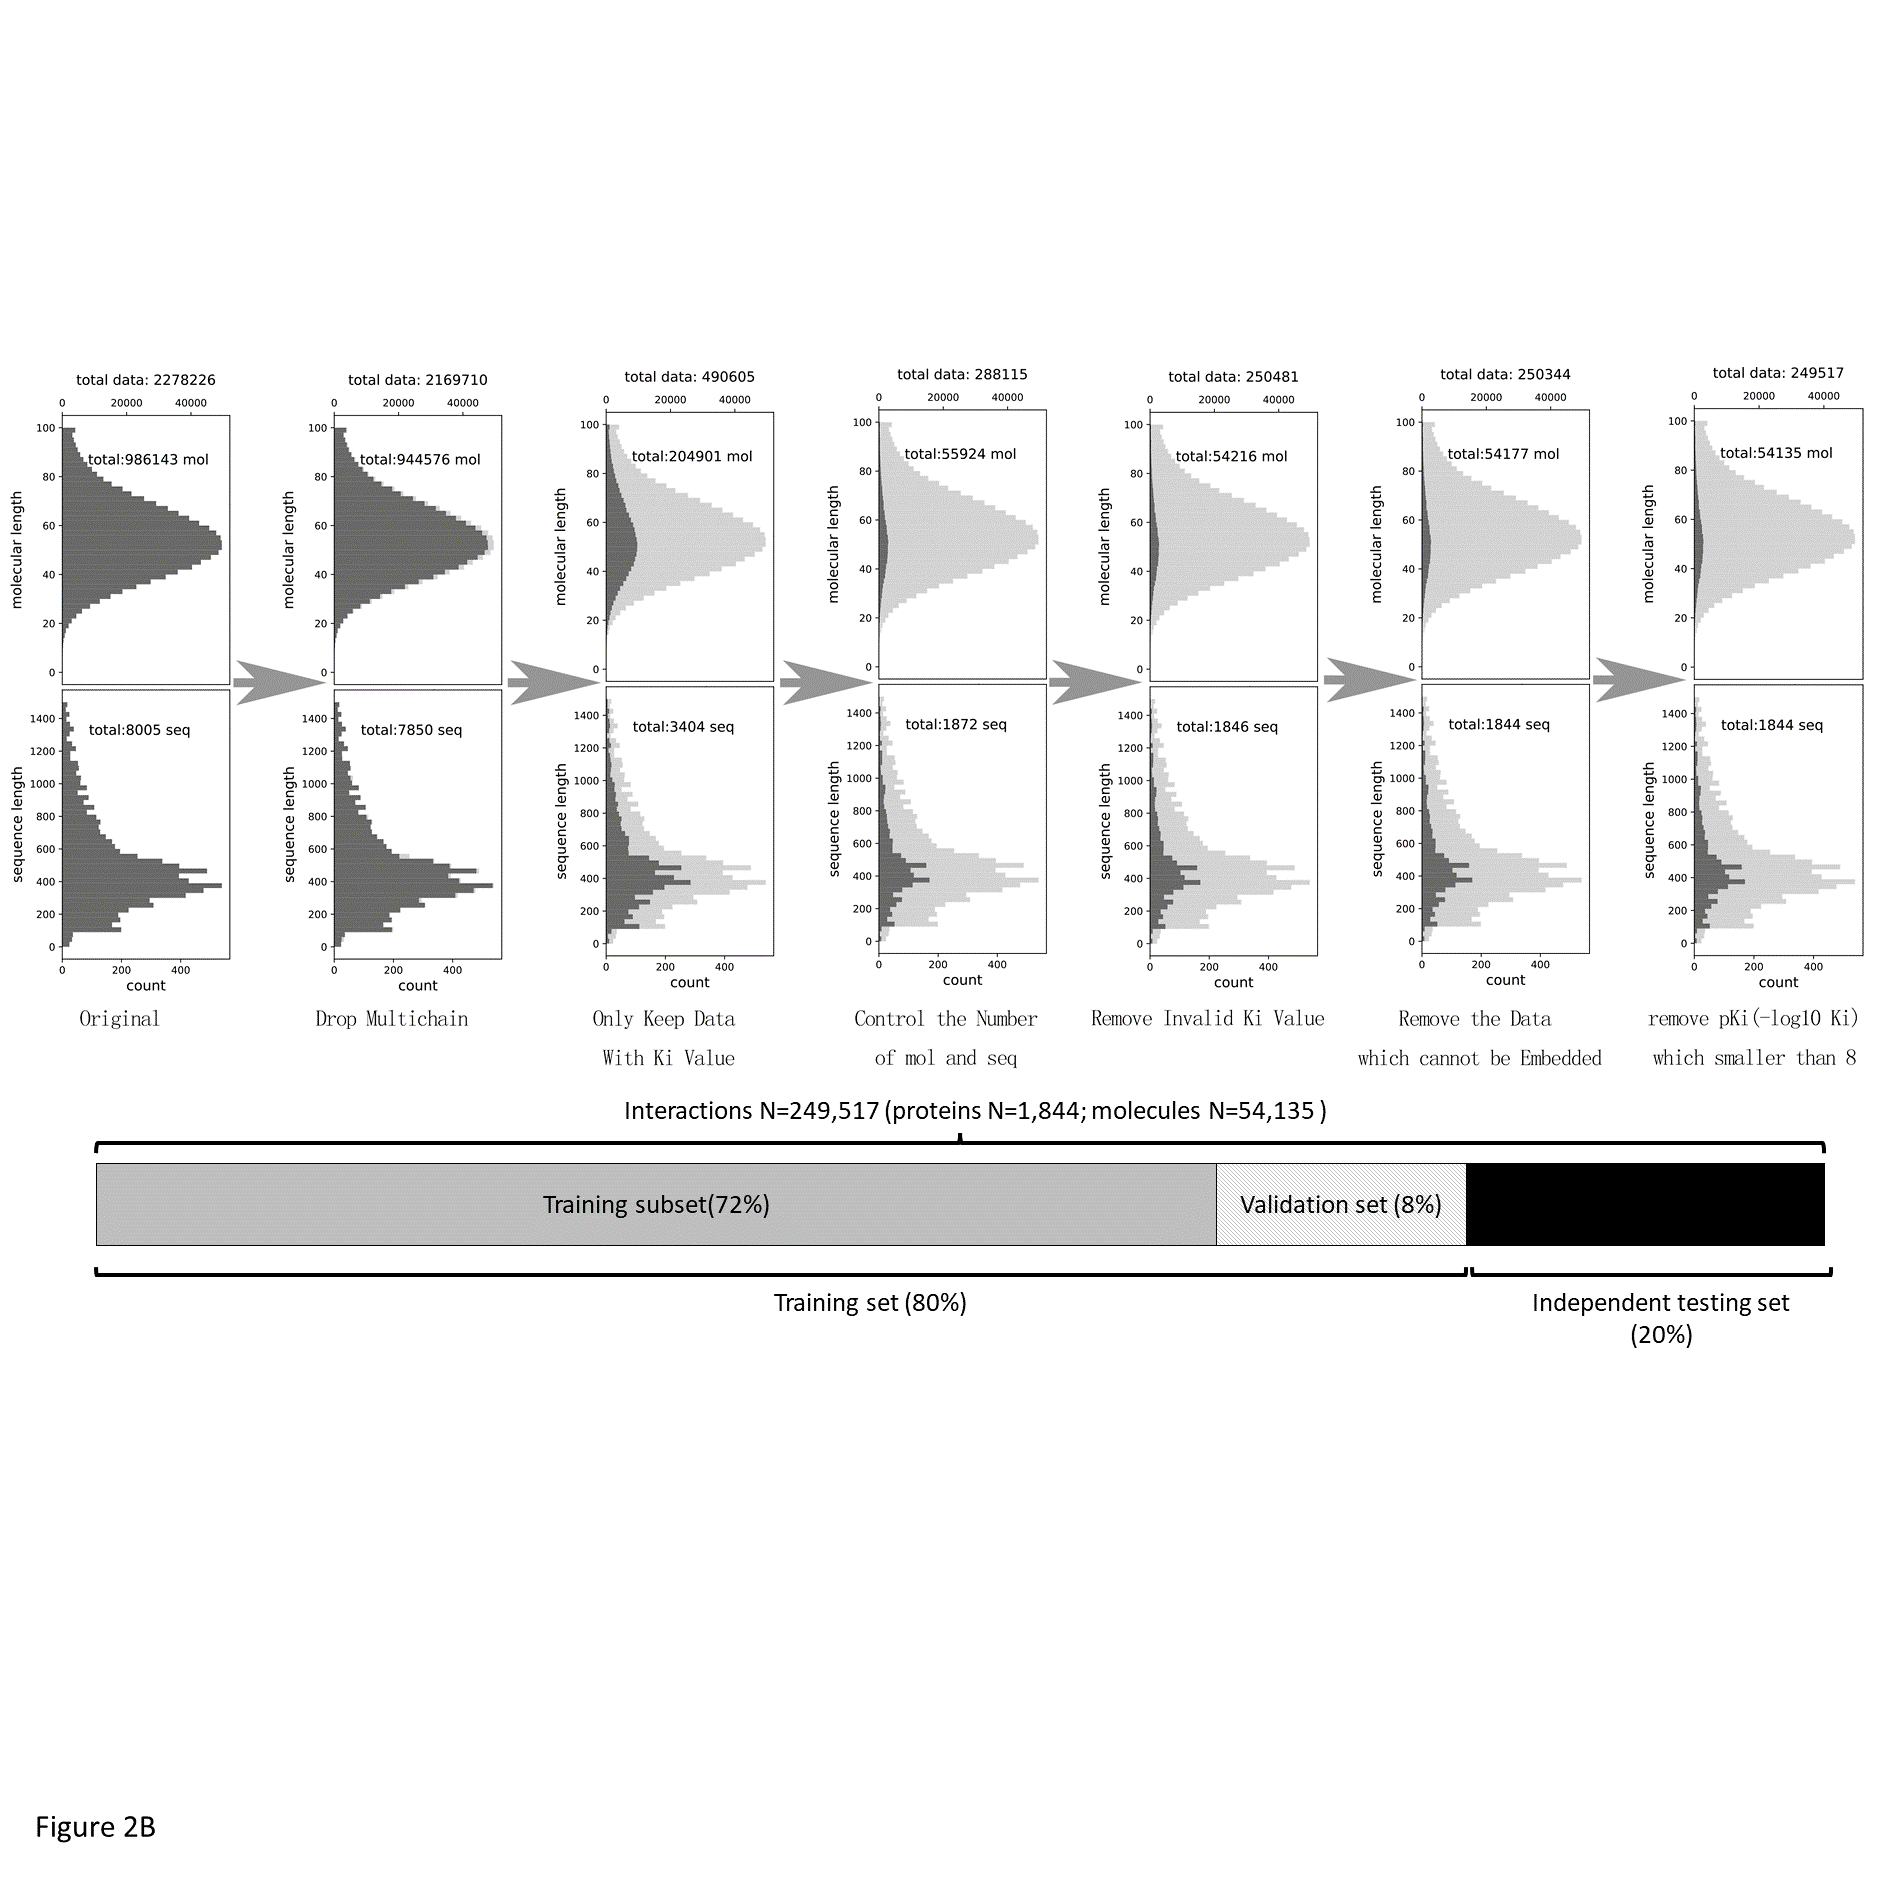
(Jaeger et al., n.d.) and ProSE (Bepler & Berger, 2021), which are popular in drug development research, to convert structure data into numeric vectors. To stabilize the training process, I follow the literature and use Kaiming initializer (K. He et al., 2015a), L2-normalization, and LR decay (K. He et al., 2015b). Finally, to measure model performance, I will follow the literature and use mean squared error (MSE), Pearson correlation, coefficient of determination (R2, i.e., R-squared), and index of concordance (CI). (Öztürk et al., 2019) These metrics reflect the deviation of predictions from different perspectives.
Some comparative statistics of my preliminary model against the state-of-the-art model DeepCDA are summarized in Table 1. As the table shows, DeepPLA manages to achieve an accuracy comparable to the benchmark, while significantly reducing the amount of time required to make predictions. Next, I plan to compare the model performance against more state-of-the-art models such as DeepDTA, and WideDTA, using different metrics. All models will be compared on equal ground with exactly the same data choice. I will also further evaluate the distribution of protein and molecular size and variety to resolve the differences in model performance.
- Table 1. Model performance against DeepCDA
¬¬ R-squared MSE Running Time My Model 0.67 1.01 2 min DeepCDA 0.65 0.96 15 min